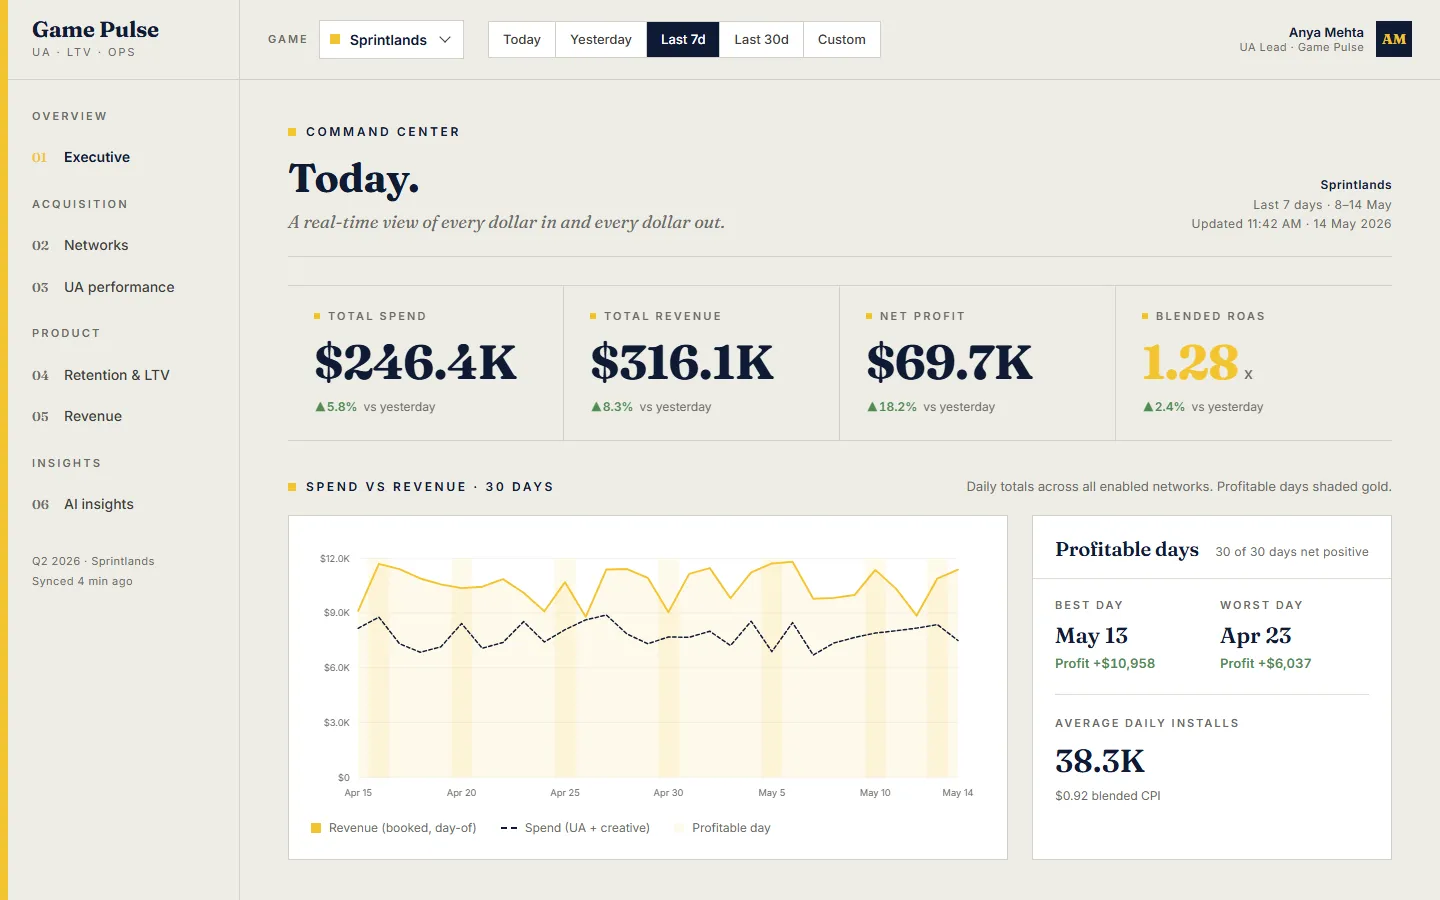
We build business intelligence tools and dashboards that pull scattered data into one trusted view, so your team can see what is happening and act on it quickly.
Most companies are not short of data. They are short of a single, trusted view of it. Numbers live in ad platforms, billing tools, CRMs, spreadsheets and databases, and someone spends hours each week stitching them together by hand.
Our BI and analytics development work connects those sources, cleans and models the data, and presents it in dashboards designed for the decisions each role has to make. We build custom tools when off-the-shelf BI cannot handle your data, your logic or your users, and we also build analytics that live inside your own product.
Who this service is for
Leadership teams that need one reliable view of performance
Marketing and growth teams combining data from multiple ad networks
SaaS companies adding analytics for their own customers
Studios and operators who track revenue, retention and acquisition costs
What we build
Executive & operational dashboards
Clear KPIs, trends and drill-downs tailored to each audience.
Data pipelines & modelling
Automated ingestion, cleaning and transformation into a consistent data model.
Multi-source integrations
Connect ad networks, payment providers, CRMs, product databases and spreadsheets.
Embedded customer analytics
Branded, permission-aware dashboards inside your product for your customers.
Automated reports & alerts
Scheduled summaries and threshold alerts delivered by email or chat.
Custom metrics & attribution
Business-specific calculations such as LTV, ROAS, cohort retention and unit economics.
Our BI & Analytics Tools approach
Start from decisions
We ask what decisions the dashboard should support, then work backwards to the data and visuals.
One source of truth
Metric definitions are documented and shared so teams stop arguing about whose number is right.
Fast and usable
Optimised queries and thoughtful design so dashboards load quickly and people actually use them.
Secure by design
Row-level permissions and role-based access protect sensitive data.
How an engagement works
Define the questionsAgree the KPIs, audiences and decisions the tool needs to support.
Connect & model the dataBuild reliable pipelines and a clean data model from your sources.
Design & build dashboardsIterate on visuals with real data and stakeholder feedback.
Automate & maintainSchedule refreshes, reports and alerts, with monitoring for data quality.
Should we use Power BI or Tableau, or build a custom dashboard?
Off-the-shelf BI is a good fit for standard reporting. Custom dashboards are worth it when you need unusual data sources, complex business logic, embedded analytics for customers or a tightly branded experience. We will recommend what suits you.
Which data sources can you connect?
Databases, spreadsheets, payment platforms, CRMs, advertising networks, analytics tools and any system that offers an API or export.
Can dashboards update in real time?
Where it adds value, yes. Many teams are well served by hourly or daily refreshes, which are simpler and cheaper, so we match refresh frequency to the decision.
How do you keep the data secure?
We apply role-based access, row-level permissions, encrypted connections and least-privilege credentials to data sources.